Statistics
In this section we look at a list of numbers and calculate
- minimum value and its position
- maximum value and its position
- sum
- average
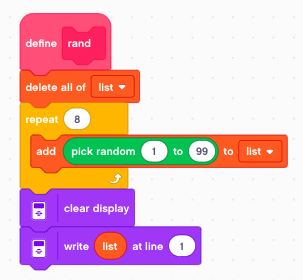
Random list
For this exercice we use a list with 8 random numbers between 1 and 99. This way we can print them on the first line of the display.
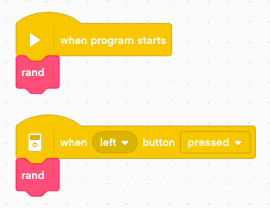
We call this function in the start event and also with the left button.
The result of this function looks like this:
86 35 49 54 37 6 93 62
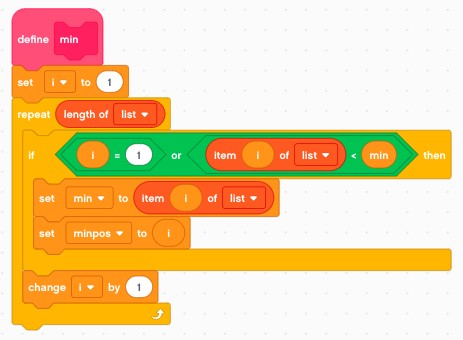
Calculate the minimum
At the first iteration i=1 we set
- min = list[1]
- minpos = 1
Then we iterate through the rest of the list. If we find a number which is smaller, we take it as the new minimum.
- min = list[i]
- minpos = i
We call this function with the down button.
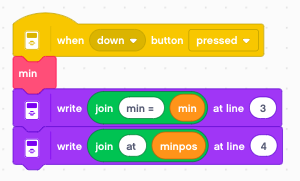
The result of this function looks like this:
86 35 49 54 37 6 93 62

min = 6
at 6
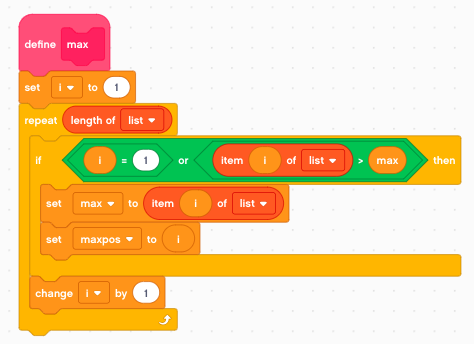
Calculate the maximum
Again, at the first iteration i=1 we set
- max = list[1]
- maxpos = 1
Then we iterate through the rest of the list. If we find a number which is larger, we take it as the new maximum.
- max = list[i]
- maxpos = i
We call this function with the up button.
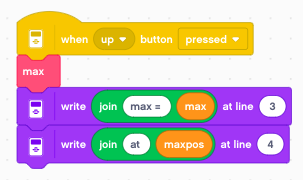
The result of this function looks like this:
86 35 49 54 37 6 93 62

max = 93
at 7
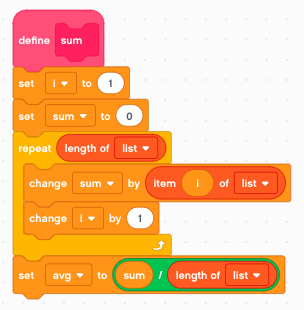
Calculate sum and average
To get the sum we add all elements of the list together. The average is obtained by dividing the sum by the number of elements.
We call this function with the center button.
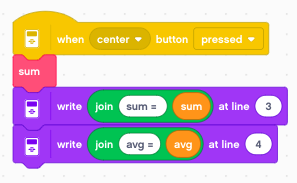
The result of this function looks like this:
86 35 49 54 37 6 93 62

max = 422
avg = 52.75